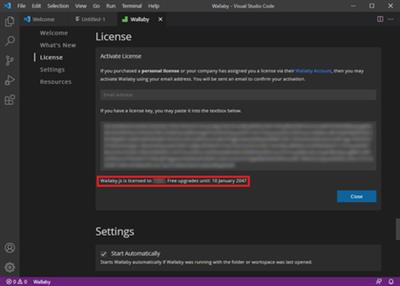
Wallaby.js v1.0.304 for VSCode | 14.1 MB
Wallaby.js is a developer productivity tool that runs your jаvascript and TypeScript tests immediately as you type, highlighting results in your IDE right next to your code. Test execution results, including code coverage, are displayed and updated in realtime right where you need to see them - in your code editor, next to the line of code that you're editing. Say goodbye to context switching.
The tool is insanely fast because it calculates and runs the minimum set of tests affected by your code changes; often only a single test needs to be run. No other testing tool is capable of operating on this level.
There is no vendor, API or framework lock-in when using Wallaby.js, because the tool is a plugin for your existing testing/UI framework and IDE. You will always be able to run your tests without Wallaby.js if you need to.
Blazingly Fast
Tests run immediately as you type, on unsaved changes, in parallel if required; no need to do anything manually. Wallaby knows how your code and tests relate, so after a change only the minimum set of tests need to re-run; no other tool is capable of operating like this. No matter how large your project grows, feedback is almost instant.
Time Travel Debugging
Move forward and backwards through your code to understand the conditions that led to a specific bug. Wallaby's Time Travel Debugger accelerates your edit, compile and debug loop by allowing you to jump to a specific line of code, view runtime values, edit-and-continue and step into, over and out of your code.
Test Stories
Inspect the code that your test is executing in a single logical view. Wallaby's Test Story Viewer allows you to see your test execution trace without having to jump between multiple functions or code files. It is ideal for both reading and debugging code. Quickly see covered lines of code, step into, over and out of your code, and view runtime values.
Inline Runtime Values
See the results of console.log and runtime variables in your editor, right next to your code. Show and copy expression values with editor commands, accessible using keyboard shortcuts. Wallaby's special comment format can also be used to evaluate expressions and includes the ability to measure code execution times.
Inline Error Reporting
Error messages are displayed right next to the code that caused them. Gutter indicators show if the current line of code is the source of an error, or if it's on the execution path of a failing test or error. Editor commands (with keyboard shortcuts) allow you to quickly navigate to the associated failing test or error source.
Inline Code Coverage
Indicators in the gutter of your code editor are constantly updated in realtime to display test coverage so you can quickly see which lines of code are fully covered, only partially covered or not covered at all. Editor commands can be used to toggle uncovered regions to see exactly which parts of your code have not been executed.
Test and Coverage Explorer
A strategic-level view of your project's tests and code coverage is available through Wallaby's locally hosted web application. Open files in your editor from your browser as you explore your tests and code-coverage. Sort and filter by name, duration, passing / failing tests, and code coverage. You can also exclude code from coverage calculations.
Test Profiler
Wallaby's Test Profiler allows you to quickly record a test's CPU usage profile to analyze its runtime performance. In addition to your own test and code files, your external dependencies code is also profiled. You can quickly navigate to a section of code you want to review by clicking on the hotspot in the profile viewer.
Output Inspector
Wallaby's Output Inspector provides an ergonomic and convenient way of inspecting logged values and errors details in a rich editor-friendly manner. Information is displayed in a code editor window, providing rich keyboard support and allowing you to stay in your coding mindset so that you don't lose your flow.
Runtime Value Explorer
Wallaby's Value Explorer allows non-primitive runtime values to be viewed and explored in an easy-to-navigate real-time treeview. This feature is great for exploring larger objects and makes debugging with Wallaby easier and faster. The tree can be expanded to any depth and paths / values can be copied directly to the clipboard.
Interactive Tests Output
Test execution results are ergonomically displayed in your editor's output window. All tests that are currently failing are listed, along with errors, diffs/snapshots, error stacks and any console.log calls. The output window's hyperlinks allow you to navigate directly to files in your editor, for example to the exact error line, or to a broken test.
Enhanced Diffs & Snapshots
When errors contain expected vs. actual values, Wallaby displays compact diffs in editor hover tips and in Wallaby's output window. A command allows you to see the diff in a side-by-side view. Jest snapshot test support includes editor commands to update snapshots for your current test, current file, or your entire project.

Buy Premium From My Links To Get Resumable Support,Max Speed & Support Me
 Views: 62
  Comments (0)
free Wallaby.js v1.0.304 for VSCode, Downloads Wallaby.js v1.0.304 for VSCode, RapidShare Wallaby.js v1.0.304 for VSCode, Megaupload Wallaby.js v1.0.304 for VSCode, Mediafire Wallaby.js v1.0.304 for VSCode, DepositFiles Wallaby.js v1.0.304 for VSCode, HotFile Wallaby.js v1.0.304 for VSCode, Uploading Wallaby.js v1.0.304 for VSCode, Easy-Share Wallaby.js v1.0.304 for VSCode, FileFactory Wallaby.js v1.0.304 for VSCode, Vip-File Wallaby.js v1.0.304 for VSCode, Shared Wallaby.js v1.0.304 for VSCode, Please feel free to post your Wallaby.js v1.0.304 for VSCode Download, Movie, Game, Software, Mp3, video, subtitle, sample, torrent, NFO, Crack, uploaded, putlocker, Rapidgator, mediafire, Netload, Zippyshare, Extabit, 4shared, Serial, keygen, Watch online, requirements or whatever-related comments here.
Related Downloads :
{related-news}


